 ,
,
Customer data is invaluable, and delivery restaurants have access to a ton of data in the POS.
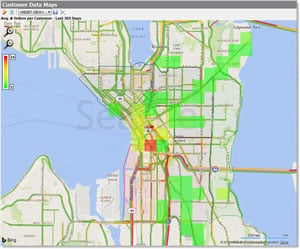
SpeedLine makes this data easier and faster to interpret with Customer Data Maps: visual "heat maps" of sales, coupon, or delivery performance data available to all LiveMaps Visual Dispatch users.
Visualize Your Business
Use Customer Data Maps to see at a glance where most late deliveries occur, or where VIP customers are concentrated. Once you've identified an area of concern (or opportunity!), it's easy to use SpeedLine reports to delve deeper and solve issues—or to prepare a targeted marketing campaign.
See more examples of how to use heat maps to understand your market.
How to Do It
If you have been using SpeedLine LiveMaps at your store for several weeks or more, you should have enough delivery data to see trends, so give it a try! A wizard will guide you through running the heat map reports:
- In Store Manager, on the Today tab, click Today's Tools.
- Click Customer Data Maps.
- On the toolbar above the map, click the wizard button.

- Follow the instructions in the Customer Data Map Wizard to select report options.
Looking Ahead
Enhancements to Customer Data Maps in the near future will delineate data boundaries very precisely, and speed up map generation. Stay tuned!