,
With a full-featured system like SpeedLine, it can be hard to keep track of all the reporting options. This month we take a look at the SpeedLine Sales Summary—a versatile, but sometimes overlooked, reporting tool. Extremely customizable, the Sales summary is like many reports in one: sales, labor, discounts, coupons, and more. The numbers can be viewed in a variety of formats, and exported to Excel.
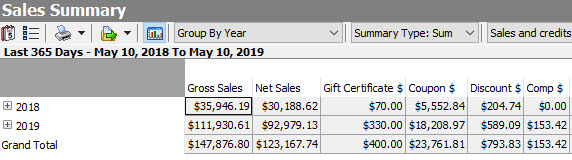
Use the Sales Summary
Use the Sales Summary to compare sales or coupon use over several time periods, track labor costs, see trends in order type sales, spot unusual credit or discount patterns, and much more.
Run a Report
- On the Store Manager Today tab, click Sales Summary.
- To get an idea of what this report is capable of, click the Select Fields button on the toolbar.

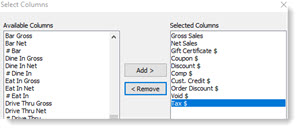
- Scroll the list, and remove any columns you aren't interested in: under Selected Columns, click the column name, and then click the Remove button to move it to Available Columns.
- When done selecting columns, click OK.
- Click the Date Range button to select the reporting period.

- Click the Compare To button if you want to compare more than one time period, and then click OK.
- In the Group By list on the toolbar, select what time period to show initially. (You can drill down to shorter time periods during viewing by clicking expand buttons.
 )
)
- In the Summary Type list, select whether you want numbers to be added (Sum), averaged (Avg), or show only minimum or maximum values.
- When done customizing, save the view to use again later by clicking the Save button.

- To save the report as an Excel spreadsheet, click the Export button on the toolbar.
 (Other file formats are available by clicking the drop-down arrow beside the Export button.)
View the Report 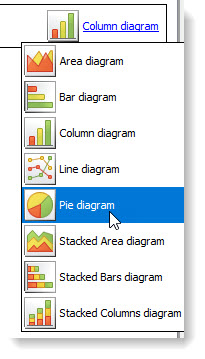
- While viewing the table, click the expand buttons to see the numbers for shorter time periods (down to the day). Note: This report contains historical sales data, so the current day's numbers won't be included until you run Day End.
- Have lots of table columns? On the Edit menu, click Full Screen to allow more room and reduce scrolling.
- Need more vertical room to expand table rows? Click the Show/Hide Chart button
 on the toolbar to remove the chart view at the bottom.
- To show a different type of chart, when the chart is showing, click the chart type on the right, and then pick a chart from the list.